FULL
West Midlands Employers and Wyre Forest District Council Equality Impact assessment of the proposed Pay and Grading review
November 2020 (implementation July 2021)
Contents
Introduction, principles and methodology
Drivers for the change
Main data analysis
Conclusion
A signed version of this EqIA is available to download; please note it may not be accessible for users of assistive technology.
If you require further help please contact us.
1. Introduction, principles and methodology
The purpose of undertaking an EQIA is to ascertain whether the proposed changes significantly adversely impact on any one group of staff, and if there is evidence of disproportional impact, whether this can be attributed to gender or other protected characteristics, or as a direct result of the changes being made for some other attributable reason.
The following Equality Impact Assessment (EQIA) has been prepared using data provided by Wyre Forest with the following data principles
- The data has a “time stamp” of 23/11/20. This will be the data set which will be used to undertaken any further amendments or modelling of the proposed grading structure so that comparisons are always undertaken on a “like for like” basis with base data.
- Posts which are vacant, temporary or due to be removed from the structure before implementation have been excluded from the data set but are available to view on an additional data sheet.
- Posts in the Senior Manager cohort have been excluded as not being part of this review.
Data on disability, sexuality, ethnicity, religion and marital status is not collected by Wyre Forest in sufficiently large numbers for it to be a useful data sample. This review has therefore focussed on gender but has also reviewed the age profile across the workforce.
2. Drivers for the change
The main considerations in the development and construction of the new grading structure have been as follows:
- To make adjustments to account for increases to the minimum wage at the bottom of the pay scale so that differentials are held
- To reduce the number of grades in the structure from bottom up and distribute spine points to “even out” anomalies across the grades
- To move back to the national pay negotiations after a number of years of local pay arrangements
- To undertake an audit of JE data and design a series of job families – providing greater flexibility and agility to move as a responsive workforce
- To resolve the ongoing issue of market force payments pressures which have resulted in honoraria / ad hoc payments to certain occupational groups
- A wish to minimise the overall impact on staff whilst keeping within a defined financial “envelope”
Any changes therefore have these overarching objectives as part of the rationale and “test” of the new pay structure – and where the changes support a particular objective this is detailed in this report.
2. Definitions
Within this report there are a number of key pay definitions with specific meaning for the purposes of this report
- Green Circles Staff who are moving into a higher grade on implementation and will have an immediate and real additional salary
- Headroom Gainers Staff who will not get an immediate increase and move across to the new grade on their existing scp but where the pay grade maximum is higher – therefore providing greater future earning potential with the ability to progress on normal time served increments, defined as more “headroom”, further than on their current grade
- Red Circles Staff who are moving to a grade where their current salary is above the grade maximum for their new grade – meaning they are currently “over” the grade
- Headroom losers Staff who are not impacted immediately in terms of loss (or protection) – so they move across on to the new grade on their current scp but who lose some future earning potential by a difference in the grade maximum from their current grade – thereby losing the ability to progress to the same point
Those impacted by headroom losses are not entitled to protection, as projected earnings are not within the scope of such arrangements.
3. Main data analysis
3.1 Grade Structure
The new grade structure has 9 grades, each with 4 spines with the exception of Grades 1 and 2 which have 3 spines
The rationale for this is that jobs in grades 1 and 2 (with a lower JE score) are likely to be less complex, have less scope for amendment and change, and therefore post holders should be able to fully deliver in a more static role in a shorter period.
The new grade structure removes spine points 14 to 18 (all of the current grade D and part of grade E). This meets the Council objective of addressing the lower pay points, evening out the grade structure to make grades more even. Although there are some differences in the points range for the grades this has been driven by the need to minimise the impact on occupational groups where an adjustment to the grade line break point reduced the number of Red Circles, and a structured view to “levels” within job families.
| Band | 1 | 2 | 3 | 4 | 5 | 6 | 7 | 8 | 9 |
|---|---|---|---|---|---|---|---|---|---|
| SCP | 19-21 | 22-24 | 25-28 | 29-32 | 33-36 | 37-40 | 41-44 | 45-48 | 49-52 |
| Points range | 331-360 | 361-410 | 411-465 | 466-510 | 511-570 | 571-600 | 601-640 | 641-670 | 670+ |
|
- |
29 | 49 | 54 | 44 | 59 | 29 | 39 | 29 |
3.2 Grade / Gender Differentials
The gender distribution for the current pay grade is shown below, and is shown against the gender distribution for the new pay grade
| Current grade | Female | Male | Total | % female in grade | % male in grade | Total in grade |
|---|---|---|---|---|---|---|
| AdHoc | 2 | 1 | 3 | 0.62% | 0.31% | 0.93% |
| D | 9 | 48 | 57 | 2.78% | 14.81% | 17.59% |
| E | 21 | 43 | 64 | 6.48% | 13.27% | 19.75% |
| F | 62 | 22 | 84 | 19.14% | 6.79% | 25.93% |
| G | 10 | 12 | 22 | 3.09% | 3.70% | 6.79% |
| H | 21 | 12 | 33 | 6.48% | 3.70% | 10.19% |
| I | 13 | 16 | 29 | 4.01% | 4.94% | 8.95% |
| J | 9 | 2 | 11 | 2.78% | 0.62% | 3.40% |
| K | 9 | 3 | 12 | 2.78% | 0.93% | 3.70% |
| L | 1 | 2 | 3 | 0.31% | 0.62% | 0.93% |
| M | 2 | 2 | 4 | 0.62% | 0.62% | 1.23% |
| N | 2 | 0 | 2 | 0.62% | 0.00% | 0.62% |
Total female employees 161
Total male employees 163
Total employees 324
| Current grade | Female | Male | Total | % female in grade | % male in grade | Total in grade |
|---|---|---|---|---|---|---|
| 1 | 15 | 48 | 63 | 4.63% | 14.81% | 19.44% |
| 2 | 26 | 46 | 72 | 8.02% | 14.20% | 22.22% |
| 3 | 51 | 25 | 76 | 15.74% | 7.72% | 23.46% |
| 4 | 34 | 19 | 53 | 10.94% | 5.86% | 16.36% |
| 5 | 13 | 18 | 31 | 4.01% | 5.56% | 9.57% |
| 6 | 7 | 1 | 8 | 2.16% | 0.31% | 2.47% |
| 7 | 11 | 1 | 12 | 3.40% | 0.31% | 3.70% |
| 8 | 0 | 3 | 3 | 0.00% | 0.93% | 0.93% |
| 9 | 4 | 2 | 6 | 1.23% | 0.62% | 1.85% |
Total female employees 161
Total male employees 163
Total employees 324
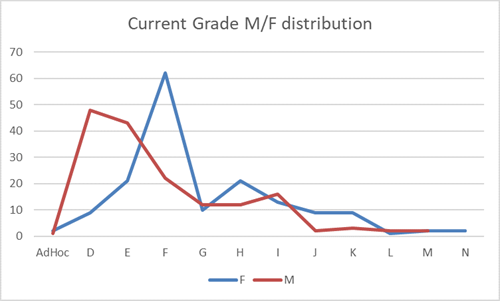
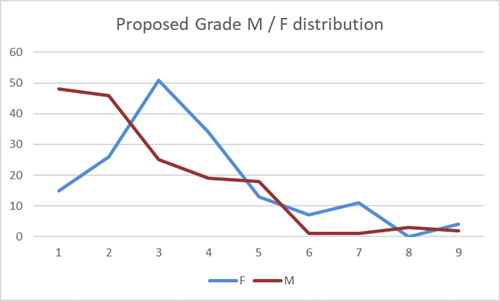
The overall pattern of distribution has not changed significantly; some differences are seen by a reduced number of grades in the proposed structure. There is a peak of females in both structures at Grade F / new band 3 – with the highest percentage of people (19.7% and 24.3% respectively) being on scp 25 in both structures.
The critical point here is that scp 25 is “removed” from the current band F and forms the lowest point of the new Grade 3 – thereby creating the dual impact of the most red circles (16 of the 29 Red circles, 13 of them women) but also 46 of the total 96 headroom gainers, with 35 of them being women. This is a greater negative percentage (44% red circles compared to 36% headroom gainers) of the overall workforce.
The data shows a high proportion of males in the bottom 2 grades in the current structure (Grades D and E) who are then in Grades 1 and 2 in the new grading structure, who are also “green circles”.
The main factor in this is the Waste Operative Loaders and Waste Operative Drivers who are currently in Grades D and E and would move into Grades 1 and 2 in the new structure. This workforce is predominantly male. The driver group also receive additional payments in addition to their basic salary.
This means therefore that when looking at impact for these groups specifically (and where the greatest number of Green Circles is arising from the bottom of the pay scale increasing there is a greater impact on males – so that although the workforce is almost 50/50 male to female split, green circles are greater in the male population.
3.3 Impact Gender differentials
| Impact | Number of females | Number of males | Total employees | % of all females | % of all males | Female as % of total | Male as % of total | Total in category |
|---|---|---|---|---|---|---|---|---|
| Green circle | 40 | 101 | 141 | 24.8% | 62.0% | 12.35% | 31.17% | 43.52% |
| HR gain | 66 | 27 | 93 | 41.0% | 16.6% | 20.37% | 8.33% | 28.70% |
| HR loss | 4 | 3 | 7 | 2.5% | 1.8% | 1.23% | 0.93% | 2.16% |
| No impact | 32 | 22 | 54 | 19.9% | 13.5% | 9.88% | 6.79% | 16.67% |
| Red circle | 19 | 10 | 29 | 11.8% | 6.1% | 5.86% | 3.09% | 8.95% |
Total female employees 161
Total male employees 163
Total employees 324
Total percentage of all females 49.54%
Total percentage of all males 50.15%
When the impact of the Waste roles is removed however the impact is reduced significantly, with 11.1% of females and 15.7% of males being in the green circle group, (see table below) but a much higher number of females being in the Headroom gainers group. This is without removing other large proportions of male workforce occupational groups (such as street cleansing) who are also having an impact on the weighting for this group.
| Impact without refuse roles | Female | Male | Total | % of all females | % of all males | Females as % of total | Males as % of total | Total in category |
|---|---|---|---|---|---|---|---|---|
| Green circle | 36 | 51 | 87 | 22.93% | 45.54% | 11.11% | 15.74% | 26.85% |
| HR gain | 66 | 26 | 92 | 42.04% | 23.21% | 20.37% | 8.02% | 28.40% |
| HR loss | 4 | 3 | 7 | 2.55% | 2.68% | 1.23% | 0.93% | 2.16% |
| No impact | 32 | 22 | 54 | 20.38% | 19.64% | 9.88% | 6.79% | 16.67% |
| Red circle | 19 | 10 | 29 | 12.10% | 8.93% | 5.86% | 3.09% | 8.95% |
| Total | 157 | 112 | 269 | 0.4831% | 0.34462% | 48.46% | 34.57% | 83.02% |
Overall females who are green, headroom gain or no impact make up 43.8% of the workforce whilst males make up 47.1% - a difference of only 3.3%
In the red circle group – using the same methodology for understanding impact as the green circle male dominated occupational groups, the main impact from red circles is from the current grade F which is currently set at scp 25 as a maximum, with a small number of roles predominantly filled by females (business support and reception) in this grade which in the new structure is capped at scp 24. There is a more mixed group of single occupation jobs across the rest of the red circle group which are not occupations dominated by a particular gender in the way the Refuse green circle jobs are.
3.4 Age profile
The current data on the age profile shows no statistically significant impact on any one age group of staff other than which has already been explored and attributed to other (occupational) reasons. The workforce has a typical age profile with larger numbers of staff in the 36 to 60 age brackets than younger or other for both the male and female population.
| Impact | 20-25 years | 26-30 years | 31-35 years | 36-40 years | 41-45 years | 46-50 years | 51-55 years | 56-60 years | 61-65 years | 66-75 years | Total employees per age range |
|---|---|---|---|---|---|---|---|---|---|---|---|
| Green circle | 4 | 10 | 10 | 8 | 14 | 15 | 12 | 16 | 10 | 2 | 101 |
| HR gain | 1 | 2 | 3 | 4 | 1 | 8 | 1 | 4 | 1 | 2 | 27 |
| HR loss | 1 | 0 | 0 | 1 | 0 | 0 | 0 | 0 | 1 | 0 | 3 |
| No impact | 2 | 3 | 2 | 2 | 3 | 3 | 5 | 1 | 0 | 1 | 22 |
| Red circle | 0 | 0 | 2 | 1 | 1 | 3 | 0 | 3 | 0 | 0 | 10 |
| Total | 8 | 15 | 17 | 16 | 19 | 29 | 18 | 24 | 12 | 5 | 163 |
| Impact | 20-25 years | 26-30 years | 31-35 years | 36-40 years | 41-45 years | 46-50 years | 51-55 years | 56-60 years | 61-65 years | 66-75 years | Total employees per age range |
|---|---|---|---|---|---|---|---|---|---|---|---|
| Green circle | 2 | 2 | 1 | 3 | 3 | 10 | 7 | 9 | 2 | 1 | 40 |
| HR gain | 0 | 2 | 2 | 6 | 13 | 11 | 13 | 13 | 5 | 1 | 66 |
| HR loss | 1 | 0 | 1 | 1 | 0 | 0 | 1 | 0 | 0 | 0 | 4 |
| No impact | 2 | 3 | 1 | 3 | 7 | 5 | 4 | 6 | 1 | 0 | 32 |
| Red circle | 0 | 1 | 2 | 0 | 2 | 2 | 6 | 3 | 3 | 0 | 19 |
| Total | 5 | 8 | 7 | 13 | 25 | 28 | 31 | 31 | 11 | 2 | 161 |
4. Conclusion
The following conclusions can be seen from the data analysis
- The overall impact of the proposal for Red Circles has a slight disproportionate impact on females, with 2.78% more women as red circles than men (equivalent to 19 posts and 5.86% of the workforce) but only a 0.7% difference on headroom losers equivalent to 1 post. Unlike the green circle group however there is no significant occupational grouping with a male / female bias and the majority of the roles (with a couple of possible exceptions mentioned in the text) are gender neutral.
- The higher proportion of Green circle male workforce is driven by occupational groups, and is mitigated by current additional pay arrangements.
- Due to the distribution of ages there are no discernible age impacts which can be identified as statistically significant.