2019
Chaddesley Corbett parish housing needs survey
Housing needs surveys are undertaken to identify the local housing needs of a parish and the type and mix of housing that may be appropriate to meet these needs.
A housing needs survey was carried out in June 2019 in the Chaddesley Corbett Parish to establish what the expected housing requirements are for the parish in the next 5-10 years.
Letters were circulated to all households in the parish inviting the residents or those with a local connection to the parish to complete an online survey. The information gathered from the responses has been used in the analysis and to complete this report.
Background
The 2011 Census advised that Chaddesley Corbett had a population of 1422. The majority of the population being of working age (25-64, 53%) followed by a large proportion of older people (aged 65 years and older, 25%) and a lower proportion of younger people (24 years and under 21%).
|
Age Groups |
Chaddesley Corbett (%) |
Wyre Forest (%) |
West Midlands (%) |
England (%) |
|---|---|---|---|---|
|
15 & Under |
14 |
17 |
19 |
18 |
|
16-24 |
8 |
9 |
13 |
13 |
|
25-64 |
53 |
52 |
53 |
53 |
|
65+ |
25 |
21 |
18 |
18 |
It can be seen that Chaddesley Corbett has a slightly higher proportion of 25-64 year olds in comparison to the district and a higher population of 65+ year olds in comparison to the local and national figures.
|
Economic Activity |
Chaddesley Corbett (%) |
Wyre Forest (%) |
West Midlands (%) |
England (%) |
|---|---|---|---|---|
|
Economically Active |
70 |
69 |
68 |
70 |
|
In Employment |
66 |
62 |
60 |
63 |
|
Employee Part Time |
12 |
15 |
14 |
14 |
|
Employee Full Time |
33 |
37 |
37 |
39 |
|
Self Employed |
21 |
10 |
9 |
10 |
|
Unemployed |
2 |
4 |
5 |
4 |
|
Full Time Student |
2 |
2 |
3 |
3 |
|
Economically Inactive |
30 |
32 |
31 |
30 |
|
Retired |
19 |
19 |
14 |
13 |
|
Student |
4 |
3 |
6 |
6 |
|
Looking after family or home |
4 |
4 |
5 |
4 |
|
Long term sick or disabled |
3 |
4 |
4 |
4 |
|
Other |
2 |
2 |
2 |
2 |
Chaddesley Corbett has a higher percentage of residents in employment than the other areas in particular Self Employment which is more than double the rate for the rest of the district and national figures.
|
Proportion of dwellings by type |
Chaddesley Corbett (%) |
Wyre Forest (%) |
West Midlands (%) |
England (%) |
|---|---|---|---|---|
|
Detached house or bungalow |
47 |
29 |
23 |
22 |
|
Semi Detached of Bungalow |
33 |
37 |
37 |
31 |
|
Terraced (including end) house or bungalow |
10 |
19 |
19 |
25 |
|
Purpose built block of flats |
3 |
10 |
10 |
17 |
|
Part of a converted or shared house |
5 |
2 |
2 |
4 |
|
Flat in a commercial building |
2 |
1 |
1 |
1 |
|
Caravan of mobile structure |
1 |
3 |
3 |
1 |
Chaddesley Corbett has a large proportion of detached dwellings in comparison to the district, regionally and nationally and a significantly lower amount of purpose built block of flats.
|
Proportion of households by tenure |
Chaddesley Corbett (%) |
Wyre Forest (%) |
West Midlands (%) |
England (%) |
|---|---|---|---|---|
|
Owned (total) of which: |
64 |
71 |
65 |
63 |
|
Owned Outright |
41 |
38 |
32 |
31 |
|
Owned with a mortgage or loan |
23 |
33 |
33 |
32 |
|
Shared Ownership |
1 |
1 |
1 |
1 |
|
Social Rented |
14 |
15 |
19 |
17 |
|
Private Rented |
18 |
13 |
13 |
16 |
|
Living rent free |
3 |
1 |
2 |
1 |
Figures for tables 1-4 provided by the 2011 census, ONS Crown Copyright
Chaddesley Corbett has a lower proportion of home owners in comparison to the rest of the Wyre Forest. The amount of people owning outright is slightly higher than the other areas but the amount of people who are home owners with a mortgage is lower. The Parish also has a higher population of residents who are private rented than the comparison areas.
Housing in rural areas
Property prices in rural areas are less affordable than in urban areas1 forcing many local residents to move away from their towns and villages in order to find suitable and affordable homes. Houses in the countryside are now 20% higher than in urban areas despite wages being lower.
The number of people on waiting lists for affordable homes in rural England has soared to around 750,0002. The number of households in England is projected to increase by 4.0 million (17%) over the next 25 years, from 22.9 million in 2016 to 26.9 million in 2041.This equates to 159,000 additional households each year. (source: Office of National Statistic -ONS). Increasing house prices and the limited availability of appropriate properties has resulted in local people being unable to find a home within their community and there is a possibility that this is happening in the Chaddesley Corbett Parish.
Methodology
As part of the Chaddesley Corbett Neighbourhood Plan, Chaddesley Corbett Parish Council and Wyre Forest District Council wanted to establish what the housing requirements were for the parish over the next 5 to 10 years. In order to gather the information 702 letters were circulated to households in Chaddesley Corbett Parish asking the residents to complete an online survey. The survey was also available to those who may have moved out of the parish within the last 5 years but still had a strong connection to the parish and were looking to move back.
The aim of the survey was to establish:
- The mix of housing need in the parish
- The tenure type (open market, subsidized, social rented or shared ownership)
- The size of the property and need by population (families, single people or older households)
- To make sure future developments are as far as possible in tune with the requirements of community.
The survey also gathered information from households that are likely to be subject to change in the near future, for example children looking to move out of the current family home but stay within the parish.
The letter inviting households to complete the online survey was sent out to all households in Chaddesley Corbett Parish early June with a deadline for completion before 26 June 2019. Respondents were asked to complete one survey per household with the opportunity of attending three open days/evenings held within the parish or completing the survey over the phone for those who didn’t wish to do so online.
Responses
A total of 705 letters were distributed and 92 responses were received in return, giving a return rate of 13%. It should be noted that only those people who have a housing need or are interested in a local needs development and general parish life are likely to respond.
The majority of people who responded currently live in the parish (95%), the average length of time that lived in the parish were 24 years (this ranged from less than a year to 80 years).
Responses were received from 188 people who formed 79 households and of those 160 adults (85%) and 28 children (15%).
Housing needs summary
The results of the housing needs survey are detailed further on in this report however in summary:
- There were 36 households looking to move, find alternative housing or additional homes within the next 10 years as some households were looking for more than one additional home there was a total of 44 homes required.
- Of the 44 households that responded confirming they have or will have a housing need within the next 10 years, the majority have advised that they will require a 2 bedroom property with the highest need being a house followed by a bungalow.
- Of the 44 households that responded advising that they could foresee a housing need within the next 10 years, up to 13 would potentially have their housing needs met through a property that becomes vacant within the parish from another respondent to the survey who would like to move. This is obviously subject to the property being suitable, becoming available at the right time and bring affordable for the household in question.
- Therefore in the next 10 years 31 homes will be required in the parish with 65% of the respondents advising that they would want a 2 bedroom property and 55% also advising that they will require a house.
- At the time of this report being written, there were no properties for sale in the required property type, size or cost brackets. This indicates aspiration outstripping what people can afford and may indicate there is some potential demand for low cost home ownership products.
Results from the questionnaire
Section 1: Current accommodation
Connection(s) to the parish
- Do you currently live in the parish
- Do you work in the parish
- Have you got relatives in the parish
- Have you previously lived in the parish
- Have another strong connection to the parish
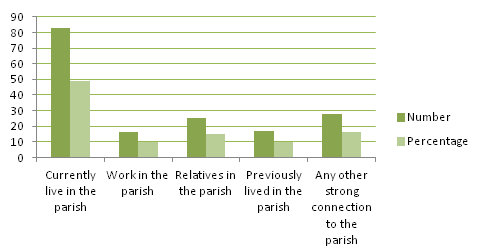
In total 169 positive responses were given to this question as some respondents selected more than one answer out of the total number of responses to the survey (92) 83 currently live in the parish (90%).
|
Connection(s) to the parish |
Number |
Percentage |
|---|---|---|
|
Currently live in the parish |
83 |
49% |
|
Work in the parish |
16 |
10% |
|
Relatives in the parish |
25 |
15% |
|
Previously lived in the parish |
17 |
10% |
|
Any other strong connection to the parish |
28 |
16% |
|
Total answered |
169 |
100% |
Including yourself how many people are there in your household?
This question asked for a breakdown of how many adults and children were in the household, we received a total of 78 responses the tables below gives a breakdown of the responses.
|
Number of adults |
Number of responses |
Number of children |
Number of responses |
|---|---|---|---|
|
1 |
12 |
1 |
7 |
|
2 |
55 |
2 |
4 |
|
3 |
6 |
3 |
3 |
|
4 |
5 |
|
|
The most popular responses were 2 adults and no children (59%) and 1 adult no children (15%), this indicates that the parish is comprised of mainly adult only households.
What type of property do you currently live in?
The majority of the households who responded currently live in a detached house (43%) followed by a semi detached house (35%).
|
Type of property |
Number of responses |
Percentage (%) |
|---|---|---|
|
Detached House |
34 |
43 |
|
Semi Detached House |
28 |
35 |
|
Detached Bungalow |
4 |
5 |
|
Terraced House |
9 |
11 |
|
Flat/Apartment |
1 |
1 |
|
Other |
3 |
4 |
How many bedrooms does your home have?
79 Households responded to this question the majority of people live in 3 bedroom home (39%) followed by a 4 bedroom home (30%).
|
Number of bedrooms |
Number of responses |
Percentage (%) |
|---|---|---|
|
1 |
1 |
1 |
|
2 |
11 |
14 |
|
3 |
31 |
39 |
|
4 |
24 |
30 |
|
5 |
10 |
13 |
|
6 |
2 |
3 |
Tenure type (Is your home...?)
This question looked at the tenure of the respondents current properties, in total 79 households answered the question with the majority being owner occupier either owned outright or with a mortgage. In comparison to the 2011 census figures there is an over representation of owner occupiers (owned outright) and a under representation of households who rent from a private landlord or Housing Association in the parish.
|
Tenure Type |
Number of responses |
Percentage (%) |
Census percentage (%) |
|---|---|---|---|
|
Owned Outright |
48 |
62 |
41 |
|
Owned with a mortgage |
19 |
24 |
23 |
|
Shared Ownership |
2 |
3 |
0.2 |
|
Rented from Housing Association |
2 |
3 |
14 |
|
Rented from Private Landlord |
6 |
8 |
18 |
|
Tied to a job |
1 |
1 |
N/A |
Has anyone from your family moved away from the Chaddesley Corbett Parish in the last 5 years? If so what are their reasons for leaving.
78 households responded to this question 57 stated no one from their family had previously moved out of the parish, 21 answered yes, the table below shows a breakdown of the reasons why their families had left. The highest reasons were to take up employment elsewhere and due to a lack of affordable housing.
|
Reasons for leaving the parish |
Number or responses |
Percentage (%) |
|---|---|---|
|
Lack of affordable housing |
8 |
38 |
|
To go to college or university |
1 |
5 |
|
Lack of suitable housing (size, features etc) |
2 |
9 |
|
To take up employment elsewhere |
8 |
38 |
|
Lack of public facilities i.e. public transport |
0 |
0 |
|
Other |
2 |
10 |
Section 2: Affordable Housing
Do you feel that the parish has a suitable range of housing for the current community and the people who would like to live there?
|
Suitable range of housing |
Number of responses |
Percentage (%) |
|---|---|---|
|
Yes |
32 |
40.5 |
|
No |
32 |
40.5 |
|
Don’t know |
15 |
19 |
79 Households responded to this question, there was an equal split between people believing that there was already a suitable range of housing and people believing there wasn’t. As part of this question we asked the respondents for the reasons why they believed this, below are the comments that we received:
- Lack of affordable housing (20)
- Lack of suitable housing price or facilities (7)
- Shortage of housing for elderly persons (4)
- Already a broad range of housing in the parish (2)
- No locals brought the school development houses (2)
- Already too many new builds here (1)
- Houses coming onto the market do not sell (1)
- I don’t know anyone looking for housing in the parish (1)
- Too many sole inhabited dwellings (1)
- Lack of social housing for rent (1)
Do you feel that the parish has adequate facilities e.g. shop/public transport for the current community and the people who would like to live there?
|
Suitable range of facilities |
Number of responses |
Percentage (%) |
|---|---|---|
|
Yes |
39 |
50 |
|
No |
33 |
42 |
|
Don’t know |
6 |
8 |
79 responses were received regarding the current facilities in the parish, 50% felt there were already adequate facilities and 42% felt there wasn’t. We also asked respondents why they believed this below are the comments that we received:
- Public transport inadequate (16)
- Most facilities are currently available i.e. shop, bus service, doctors, school, village hall (6)
- Lack of or poor quality of shops available (6)
- More doctors required (2)
- Loss of post office from the village (2)
- Poor parking (1)
- Current facilities are expensive (1)
- No shops in Harvington (1)
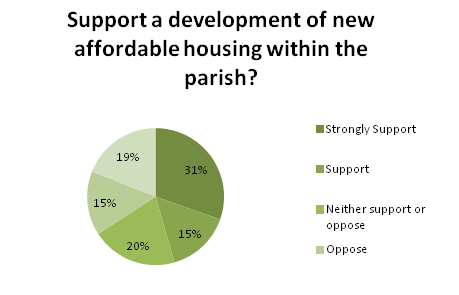
To what degree would you support a development of new affordable housing for rent/shared ownership within your parish for the people with a local connection?
We received 79 responses to this question with the majority of households supporting the prospect of future affordable housing (46%) and (34%) opposing. The table and chart below shows a full breakdown of the responses received.
|
Responses |
Number of responses |
Percentage (%) |
|---|---|---|
|
Strongly Support |
24 |
31 |
|
Support |
12 |
15 |
|
Neither support or oppose |
16 |
20 |
|
Oppose |
12 |
15 |
|
Strongly oppose |
15 |
19 |
Section 3: Alternative accommodation
This section of the survey asked the householders if they were likely to move home now or within the next 10 years, if they indicated that they would be looking for alternative accommodation then we asked what type of property they would prefer to move into, the tenure type and the affordability. The responses to these questions were used towards the base of our prediction of the future housing needs in Chaddesley Corbett.
Are you the householder, looking to move into alternative accommodation within the parish within the next 10 years?
26 householders (28%) indicated that they would require an alternative home in Chaddesley Corbett parish within the next 10 years.
5 householders advised that they would be looking to move within the next 12 months, 12 will be looking to move in the next 13 months to 5 years and 9 within 5-10 years.
The response to the questions confirming the types of homes that the householders will be looking for and vacating is detailed in the tables in appendix 1.
Section 4: Additional households
This section asked the respondents if any current members of their household would be looking to move within the next 10 years to create a new separate household within the parish. If they indicated that there would be members looking to create a new household then we asked them for more information including the property type that they would prefer to move into, the tenure type and the affordability.
Do any of the current members of your household wish to form a new household inside the parish within the next 10 years?
10 respondents (%) indicated that members of their current household will be looking for an additional home(s) within the next 10 years.
3 of the respondents stated that they will need 1 additional home, 6 will need 2 additional homes and 1 will require 3 additional homes.
2 responses advised that they will require additional homes within the next 12 months, 6 in 13 months to 5 years and 10 in 5-10 years.
The breakdown of the responses regarding the types of properties required and the tenure type is detailed in tables 1-6 in appendix 1.
|
Homes required |
Number of respondents |
Total number of additional homes needed. |
|---|---|---|
|
One alternative homes is likely to be needed for some/all current occupants |
26 |
26 |
|
One additional home is likely to be needed for some current occupants |
3 |
3 |
|
Two additional homes are likely to be needed for some current occupants |
6 |
12 |
|
Three additional homes are likely to be needed for some current occupants |
1 |
3 |
|
Total |
36 |
44* |
*13 of these homes could be met through natural churn subject to appropriate timing, availability and costs.
Results
The tables in appendix 1 detail the responses received to those households that indicated they will be looking for alternative accommodation and/or additional accommodation in the next 10 years. Respondents were asked to identify what they felt is needed in terms of property type and size together with a preferred tenure type. In reality it may not be possible to meet aspirations of each respondent, income and likely property prices are considered in order to ensure that any proposed future homes would indeed meet the needs of those to be housed. Therefore a “likely allocation/purchase” is suggested to outline provision.
Homes required within the next 12 months.
Table 1 and 2 in appendix 1 show the housing needs for the next 12 months, Table 1 shows the responses of the respondents who will be looking for an alternative home, the home they will be vacating and what they are likely to purchase or be allocated with. Table 2 shows the responses of the respondents looking for an additional home(s) and what homes they are likely to purchase or be allocated with, taking into account the affordability amounts in comparison with the property/rental prices from the last 12 months on Right Move.
After matching up the homes that will be vacated to any that will be required (these properties are highlighted) the following housing need will be outstanding in the next 12 months:
- 1x2 bed bungalow - Private rented
- 1x2 bed house - Owner occupier
- 1x2 bed flat/apartment - Owner occupier
- 1x 4 bed house - Owner occupier
Therefore there will be a demand in the next 12 months in the parish for 4 homes:
- 1 property required in the private rental market to rent
- 3 properties required in the open market for local people to purchase.
Homes required in the next 13 months - 5 years.
Tables 3&4 in appendix 1 show the housing needs for the next 13 months-5 years.
After matching up the homes that will be vacated to any that will be required (these properties are highlighted) the following housing need will be outstanding in the next 13 months to 5 years:
- 1x 3 bed house- Shared ownership
- 2x 2 bed house- Shared ownership
- 2x 2 bed bungalows- Social rented
- 1x 2 bed flat/apartment- Owner occupier
- 1x 2 bed bungalow- Owner occupier
- 2x 3 bed house- Owner occupier
- 3x 4 bed house- Owner occupier
Therefore there will be a demand in the next 13 months -5 years in the parish for 12 homes:
- 3 properties required for shared ownership
- 2 properties required for social rented for local people to rent
- 7 properties required in the open market for local people to purchase
Homes required in 5-10 years.
Tables 5&6 in appendix 1 show the housing needs for the next 5-10 years.
After matching up the homes that will be vacated to any that will be required (these properties are highlighted) the following housing need will be outstanding in the next 5 to 10 years:
- 2x 2 bed flat/apartment- Shared ownership
- 1x 2 bed bungalow- Social rented
- 1x 2 bed house- Social rented
- 3x 2 bed house- Owner occupier
- 2x 3 bed house- Owner occupier
- 4x 2 bed bungalow- Owner occupier
- 1x 3 bed bungalow- Owner occupier
- 1x 4 bed house- Owner occupier
Therefore there will be a demand in the next 5-10 years in the parish for 15 homes:
- 2 properties required for shared ownership
- 2 properties required for social rented for local people to rent
- 11 properties required in the open market for local people to purchase
Total of dwellings required in the next 10 years.
|
Property Type |
2 bed |
3 bed |
4 bed |
Total |
|---|---|---|---|---|
|
Owner Occupier |
||||
|
House |
4 |
4 |
5 |
13 |
|
Bungalow |
5 |
1 |
0 |
6 |
|
Flat/Apartment |
2 |
0 |
0 |
2 |
|
Total |
11 |
5 |
5 |
21 |
|
Shared Ownership |
||||
|
House |
2 |
1 |
0 |
3 |
|
Flat |
2 |
0 |
0 |
2 |
|
Total |
4 |
1 |
0 |
5 |
|
Private Rented |
||||
|
Bungalow |
1 |
0 |
0 |
1 |
|
Total |
1 |
0 |
0 |
1 |
|
Social Rented |
||||
|
House |
1 |
0 |
0 |
1 |
|
Bungalow |
3 |
0 |
0 |
3 |
|
Total |
4 |
0 |
0 |
4 |
|
Overall Total |
20 |
6 |
5 |
31 |
The largest need regarding the amount of bedrooms required by a large proportion is 2 bedrooms with 65% of the demand, followed by 3 bedrooms with 19% and 4 bedrooms with 16%.
The highest need regarding property types is houses with 55% followed by bungalows with 32% and flats/apartments with 13%.
The highest need regarding tenure type is owner occupier with 68%, followed by shared ownership with 16%, then social rented with 13% and finally private rented with 3%.
Comparison of properties being vacated and housing need.
The amount of properties that would be available naturally through the residents moving on and finding alternative accommodation in the next 10 years is 26. The total amount of these properties taken up by natural churn is 13 therefore the amount of properties that will still be available to purchase or rent as there wasn’t a need for them from the respondents of the survey is 13.
|
Property Type |
1 bed |
2 bed |
3 bed |
4 bed |
5 bed+ |
Total |
|---|---|---|---|---|---|---|
|
Within the next 12 months |
||||||
|
Owner Occupier |
||||||
|
House |
0 |
0 |
0 |
0 |
1 |
1 |
|
Private Rented |
||||||
|
House |
0 |
1 |
0 |
0 |
0 |
1 |
|
Total |
0 |
1 |
0 |
0 |
1 |
2 |
|
Within 13 months-5 years |
||||||
|
Owner Occupier |
||||||
|
House |
0 |
0 |
0 |
0 |
2 |
2 |
|
Private Rented |
||||||
|
House |
0 |
1 |
0 |
2 |
0 |
3 |
|
Social Rented |
||||||
|
House |
0 |
0 |
1 |
0 |
0 |
1 |
|
Total |
0 |
1 |
1 |
2 |
2 |
6 |
|
Within 5-10 Years |
||||||
|
Owner Occupier |
||||||
|
House |
0 |
0 |
0 |
0 |
4 |
4 |
|
Private Rented |
||||||
|
House |
0 |
0 |
1 |
0 |
0 |
1 |
|
Total |
0 |
0 |
1 |
0 |
4 |
5 |
|
Overall total |
0 |
2 |
2 |
2 |
7 |
13 |
Would you/the prospective householders expect to be?
This part of the survey asked the respondents that indicated that they would be looking for either an alternative home or additional home(s) what type of tenure they will be looking at to finance it.
There were 44 responses to this question in total.
|
Tenure Type |
House |
Bungalow |
Flat/apartment |
Total |
% |
|---|---|---|---|---|---|
|
Owner Occupier |
29 |
7 |
2 |
38 |
87 |
|
Private Rented |
0 |
1 |
0 |
1 |
2 |
|
Social Rented |
1 |
3 |
0 |
4 |
9 |
|
Shared Ownership |
1 |
0 |
0 |
1 |
2 |
The majority of respondents (87%) would prefer to be an owner occupier followed by rented from a Housing Association (9%).
House prices
Respondents who indicated that they would have a housing need in the next 10 years were asked how much they felt they would be to afford if either renting or purchasing a property. If they answered that they would be looking to rent they were informed that “it is normal to consider one third of the households’ net income for the period, please do not include housing benefit”. If they answered that they would be looking to purchase a property then they were informed that “it is normal to consider three times the households gross income for mortgage purposes plus any savings and equity the household may have in any property.”
There were 45 responses in total 40 for purchasing and 5 for renting the tables below show a breakdown of the responses given.
|
Housing need Type |
Up to 50k |
£50,000-£100,000 |
£100,001- £150,000 |
£150,001-£200,000 |
£200,001-£250,000 |
£250,001- £300,000 |
£300,001- £350,000 |
£350,000-£400,000 |
£400,000-£500,000 |
Over £500,000 |
|---|---|---|---|---|---|---|---|---|---|---|
|
Alternative Household |
0 |
1 |
0 |
1 |
2 |
4 |
3 |
4 |
0 |
8 |
|
Additional Household |
0 |
4 |
6 |
4 |
1 |
1 |
1 |
0 |
0 |
0 |
|
Total |
0 |
5 |
6 |
5 |
3 |
5 |
4 |
4 |
0 |
8 |
|
Percentage |
0% |
12.5% |
14.5% |
12.5% |
8% |
12.5% |
10% |
10% |
0% |
20% |
The highest response rate in the affordability category for purchasing was £500,000+ with 20% of the responses followed by £100,000-£150,000 with 14.5% and both £50,000-£100,000 and £150,001- £200,000 with 12.5%.
|
Housing Need Type |
Up to £222.00 per month |
£221-£300 per month |
£301-£390 per month |
£391-£520 per month |
£521-£650 per month |
£650+ per month |
|---|---|---|---|---|---|---|
|
Alternative Household |
0 |
0 |
0 |
1 |
3 |
0 |
|
Additional Household |
0 |
0 |
0 |
1 |
0 |
0 |
|
Total |
0 |
0 |
0 |
2 |
3 |
0 |
|
Percentage |
0 |
0 |
0 |
40% |
60% |
`0 |
The highest response category for respondents looking at renting was £521-£650 per month with 60% this was followed by £391-£390 per month with 40%.
Overall based on the average for all of the home types, for those looking for an alternative home to buy the most common range households felt they could afford was over £500,000 (35%). Amongst those looking for an alternative home(s) for members of their current household the most common price range was £100,000-£150,000 (35%). The most preferred rental price an alternative home was £521-£650 per month (75%) and £391-£520 per month (100%) for an additional home.
As of August 2019 (source: www.rightmove.com) there were 5 properties for sale in Chaddesley Corbett and no properties for rent. All of the properties advertised during this time fell into the larger category regarding size and on the £500,000+ price bracket. Whilst these properties may be suitable to some of the households looking for an alternative property they would not be suitable for those households looking for an additional property as they fall both outside the size and affordability brackets.
This indicates there is some disparity between what people could afford to purchase in the parish and the actual house prices (the affordability gap) which isn’t uncommon in rural areas and would probably indicate a need for a greater number of low cost homes and other affordable forms of housing.
The table below shows the types of properties for sale as of 13th August 2019 and the asking price. There were no properties on the market for rent.
|
Property for sale/rent |
Price |
|---|---|
|
4 Bed Detached House |
£795,000 |
|
4 Bed Detached House |
£700,000 |
|
4 Bed Barn Conversion |
£625,000 |
|
4 Bed Detached House |
£624,950 |
|
4 Bed Detached House |
£575,000 |
Conclusion
There was a response rate of 13% to this survey. Out of the responses received 36 residents indicated that they would be looking to move or need additional homes within the next 10 years.
From the 36 responses 44 homes would be required in total and 13 could be met by natural churn therefore a minimum of 31 additional homes will be required within the parish within the next 10 years. However not all of those whose housing needs can be met with natural churn will be able to afford the properties that become available within the parish and therefore the need for new affordable housing will be greater.
In total within the next 10 years the following new homes could be required:
- 21 Owner Occupier properties: 11 x 2 beds, 5 x 3 beds and 5 x 4 beds
- 5 Shared Ownership properties: 4 x 2 beds and 1 x 3 beds
- 4 Social rented properties: 4 x 2 beds
- 1 Private Rented Property: 1 x 2 bed
The findings of the Housing Needs survey supports the view in the Neighbourhood Plan that, if any development opportunities should arise, then the accommodation to be built needs to include affordable housing for rental or shared ownership (or other type of low cost home ownership product) and this should be a mix of sizes and types. The affordable housing should meet the requirements of the Council’s rural Local Connection Policy and local connection.
Appendix 1
|
Our Ref |
Current Property Type |
Current Property Size |
Current Property Tenure |
Preferred Home Type |
Preferred Tenure Type |
Bedrooms Required |
Likely Allocation/Purchase |
|---|---|---|---|---|---|---|---|
|
1 |
House |
3 bed |
Owner Occupier |
House |
Owner Occupier |
4 bed |
4 bed house- Owner occupier |
|
16 |
House |
2 bed |
Private Rented |
Bungalow |
Private Rented |
2 bed |
2 bed bungalow- Private rented |
|
34 |
Bungalow |
3 bed |
Owner Occupier |
House |
Owner Occupier |
3 bed |
3 bed house- Owner occupier |
|
50 |
House |
4 bed |
Owner Occupier |
House |
Owner Occupier |
4 bed |
4 bed house-Owner occupier |
|
67 |
House |
5 bed |
Owner Occupier |
Bungalow |
Owner Occupier |
3 bed |
3 bed bungalow-Owner occupier |
|
Our Ref |
Preferred Property Type |
Preferred Property Size |
Preferred Tenure Type |
Likely allocation/purchase |
|---|---|---|---|---|
|
5 |
House |
2 bed |
Owner Occupier |
2 bed house-Owner occupier |
|
9 |
Flat/Apartment |
2 bed |
Owner Occupier |
2 bed Flat/Apart- Owner occupier |
|
Our Ref |
Current Property Type |
Current Property Size |
Current Property Tenure |
Preferred Home Type |
Preferred Tenure Type |
Bedrooms Required |
Likely Allocation/Purchase |
|---|---|---|---|---|---|---|---|
|
12 |
House |
3 bed |
Social Rented |
House |
Shared Ownership |
3 bed |
3 bed house- Shared ownership |
|
18 |
House |
3 bed |
Owner Occupier |
House |
Owner Occupier |
3 bed |
3 bed house- Owner occupier |
|
23 |
House |
2 bed |
Owner Occupier |
House |
Owner Occupier |
3 bed |
3 bed house- Owner occupier |
|
31 |
House |
3 bed |
Owner Occupier |
House |
Owner Occupier |
3 bed |
3 bed house-Owner occupier |
|
35 |
House |
2 bed |
Private Rented |
Bungalow |
Social Rented |
2 bed |
2 bed bungalow- Social Rented |
|
40 |
House |
1 Bed |
Owner Occupier |
Bungalow |
Social Rented |
2 bed |
2 bed bungalow- Social rented |
|
43 |
House |
3 bed |
Owner Occupier |
Bungalow |
Owner Occupier |
2 bed |
2 bed bungalow- Owner occupier |
|
49 |
House |
4 bed |
Private Rented |
House |
Owner Occupier |
4 bed |
4 bed house – Owner occupier |
|
51 |
House |
4 bed |
Private Rented |
House |
Owner Occupier |
4 bed |
4 bed house- Owner occupier |
|
57 |
House |
2 bed |
Owner Occupier |
House |
Owner Occupier |
3 bed |
3 bed house- Owner occupier |
|
74 |
House |
6 bed |
Owner Occupier |
House |
Owner Occupier |
4 bed |
4 bed house-Owner occupier |
|
82 |
House |
5 bed |
Owner Occupier |
House |
Owner Occupier |
2 bed |
2 bed house- Owner occupier |
|
Our Ref |
Preferred Property Type |
Preferred Property Size |
Preferred Tenure Type |
Likely allocation/purchase |
|---|---|---|---|---|
|
3 |
House |
2 bed |
Owner Occupier |
2 bed house- Shared ownership |
|
3 |
House |
2 bed |
Owner Occupier |
2 bed house-Shared ownership |
|
8 |
House |
4 bed |
Owner Occupier |
3 bed house- Owner occupier |
|
9 |
Flat/Apartment |
2 bed |
Owner Occupier |
2 bed flat/apartment- Owner occupier |
|
10 |
House |
1 bed |
Owner Occupier |
1 bed house- Owner occupier |
|
12 |
House |
2 bed |
Owner Occupier |
2 bed house- Owner occupier |
|
Our Ref |
Current Property Type |
Current Property Size |
Current Property Tenure |
Preferred Home Type |
Preferred Tenure Type |
Bedrooms Required |
Likely allocation/purchase |
|---|---|---|---|---|---|---|---|
|
7 |
Flat |
2 bed |
Owner Occupier |
Bungalow |
Owner Occupier |
2 bed |
2 bed bungalow- Owner occupier |
|
19 |
House |
3 bed |
Owner Occupier |
House |
Owner Occupier |
4 bed |
4 bed house-Owner occupier |
|
42 |
House |
4 bed |
Owner Occupier |
House |
Owner Occupier |
4 bed |
4 bed house-Owner occupier |
|
45 |
House |
5 bed |
Owner Occupier |
Bungalow |
Owner Occupier |
3 bed |
3 bed bungalow- Owner occupier |
|
52 |
House |
5 bed |
Owner Occupier |
House |
Owner Occupier |
3 bed |
3 bed house- Owner occupier |
|
66 |
House |
5 bed |
Owner Occupier |
Bungalow |
Owner Occupier |
2 bed |
2 bed bungalow-Owner occupier |
|
77 |
House |
5 bed |
Owner Occupier |
Bungalow |
Owner Occupier |
2 bed |
2 bed bungalow- Owner occupier |
|
86 |
House |
3 bed |
Private Rented |
Bungalow |
Social Rented |
2 bed |
2 bed bungalow- Social Rented |
|
88 |
House |
4 bed |
Owner Occupier |
Bungalow |
Owner Occupier |
2 bed |
2 bed bungalow- Owner occupier |
|
Our Ref |
Preferred Property Type |
Preferred Property Size |
Preferred Tenure Type |
Likely allocation/purchase |
|---|---|---|---|---|
|
1 |
House |
2 bed |
Owner Occupier |
2 bed house- Owner occupier |
|
2 |
House |
3 bed |
Owner Occupier |
3 bed house- Owner occupier |
|
2 |
House |
3 bed |
Owner Occupier |
2 bed house- Owner occupier |
|
2 |
House |
3 bed |
Owner Occupier |
3 bed house- Owner occupier |
|
4 |
Flat/Apartment |
2 bed |
Owner Occupier |
2 bed flat/apartment- Shared ownership |
|
4 |
Flat/Apartment |
2 bed |
Owner Occupier |
2 bed flat/apartment- Shared ownership |
|
5 |
House |
2 bed |
Social Rented |
2 bed house- Social rented |
|
6 |
House/Flat |
2 bed |
Owner Occupier |
2 bed house/flat- Owner occupier |
|
8 |
House |
4 bed |
Owner Occupier |
4 bed house- Owner occupier |
|
10 |
House |
2 bed |
Owner Occupier |
2 bed house-Owner occupier |
1Halifax Rural Housing Review 2016: “the average property price in rural areas is 7.4 times the average annual earnings with a ratio of 6.4 in urban areas. Return to housing in rural areas.
2National Housing Federation, Rural Housing research report 2016. Return to housing in rural areas.